【D3.js 学习记录(实战)】Force 力导图数据可视化
2021-08-07
Force Simulation 力导图实战 @ D3.js
数据结构
做力导图使用到的数据为json数据,一般采用json数据来表达图结构。本次实验选用的json数据数据结构如下(图片中为经过了力模拟后的):
- links至少要由
target,source组成- 这连个属性标记了起始node和终止node,其值通
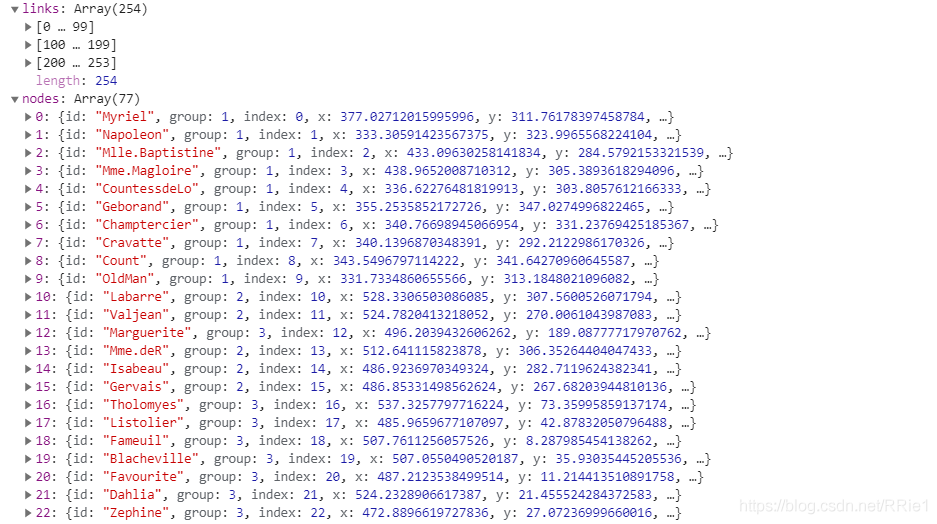 常为node的id。
- 这连个属性标记了起始node和终止node,其值通
- node由
group和id构成- group表示node属于哪一类(方便着色)
- id是node的唯一标识符
思路分析
- 画布初始化,全局变量定义
- 数据读取
- 力模拟
- 数据绑定 datajoin
- 结点node(
<circle>和<text>) - 连边link
- 结点node(
simulation.on("tick",tick),tick函数编写- drag 拖曳交互设计
画布初始化,全局变量定义
这步比较基础,直接贴上代码
const svg = d3.select('svg');
const height = +svg.attr('height');
const width = +svg.attr('width');
const margin = {
	top: 150,
	left: 50,
	right: 50,
	bottom: 0,
};

const innerHeight = height - margin.top - margin.bottom;
const innerWidth = width - margin.left - margin.right;
var color = d3.scaleOrdinal(d3.schemeCategory10);
let link;
let nodes;
let simulation;
const render_init = function () {
	svg
		.append('text')
		.attr('class', 'title')
		.attr('font-size', '2em')
		.attr('x', margin.left)
		.attr('y', margin.top / 2)
		.attr('transform', `translate(0,-40)`)
		.attr('font-weight', 'bold')
		.attr('fill', 'blue')
		.html('Force  Simulation');

	svg
		.append('g')
		.attr('id', 'maingroup')
		.attr('x', margin.left)
		.attr('y', margin.top)
		.attr('transform', `translate(${margin.left},${margin.top})`)
		.attr('width', innerWidth)
		.attr('height', innerHeight);
};
数据读取
通常读取进来的数据要进行预处理,但是图数据有些不同。通常我们拿到的数据都是不符合d3力导图数据结构要求的。一般用python等语言写的脚本文件进行数据预处理整理成符合要求的数据结构。
d3.json('./data/miserables.json').then((data) => {
	render_init(); //画布初始化
	//force simulation 力模拟
	//data join 数据绑定
	//drag  交互事件
});
力模拟
有两点需要注意的地方:
- forceLink这里要处理一下,绑定
node.id。不然会按照node的索引来进行,这样设置tick的时候会非常不方便 - 仅进行力模拟结点的位置不会进行实时更新,必须要有
simulation.on(tick)才会把力模拟的结果反映到图元上
simulation = d3
	.forceSimulation()
	.nodes(data.nodes)
	.force(
		'link',
		d3.forceLink(data.links).id((d) => d.id),
	)
	.force('manyBody', d3.forceManyBody())
	.force('center', d3.forceCenter(innerWidth / 2, innerHeight / 2))
	.on('tick', tick);
数据绑定 datajoin
这里我们需要绑定的三个元素为: 结点,结点名称,链接
结点与结点名称
一个传统的方法是 circle和 text分开绑定,但是这里采用一个更加高效的办法:就是创建一个<g>, 每个g标签代表一个结点,其中包含 circle和 text两个图元
- 创建结点group
<g>
nodes = group
	.append('g')
	.attr('class', 'nodegroup')
	//先创建一个group,其中包含所有结点(这步可有可无)
	.selectAll('.node')
	.data(data.nodes)
	.join('g')
	.attr('class', 'node');
-
结点绑定(circle)
var circle = nodes .append('circle') .attr('r', 5) .attr('fill', (d) => color(d.group)); -
结点名称绑定
var label = nodes
	.append('text')
	.attr('x', 6)
	.attr('y', 3)
	.html((d) => d.id)
	.attr('font-size', '12px');
链接
这里有个坑,line标签是不能设置 fill的,应该通过设置 stroke属性来设置line的颜色。
//注意设置stroke
link = group
	.append('g')
	.attr('class', 'linkgroup')
	.selectAll('line')
	.data(data.links)
	.enter()
	.append('line')
	.attr('stroke-width', (d) => Math.sqrt(d.value))
	.attr('stroke', 'green')
	.attr('stroke-opacity', 0.6);
tick函数编写
在tick函数中,我们要更新node的位置和link的起点和终点
注意:node指包含了circle和text的那个group,这里只需要更新那个group的位置,<circle>和<text>就会一起更新。这就是上面提出为什么要把<circle>和<text>放在一个<g>中。
const tick = function () {
	link
		.attr('x1', (d) => d.source.x)
		.attr('y1', (d) => d.source.y)
		.attr('x2', (d) => d.target.x)
		.attr('y2', (d) => d.target.y);

	nodes.attr('transform', (d) => `translate(${d.x},${d.y})`);
};
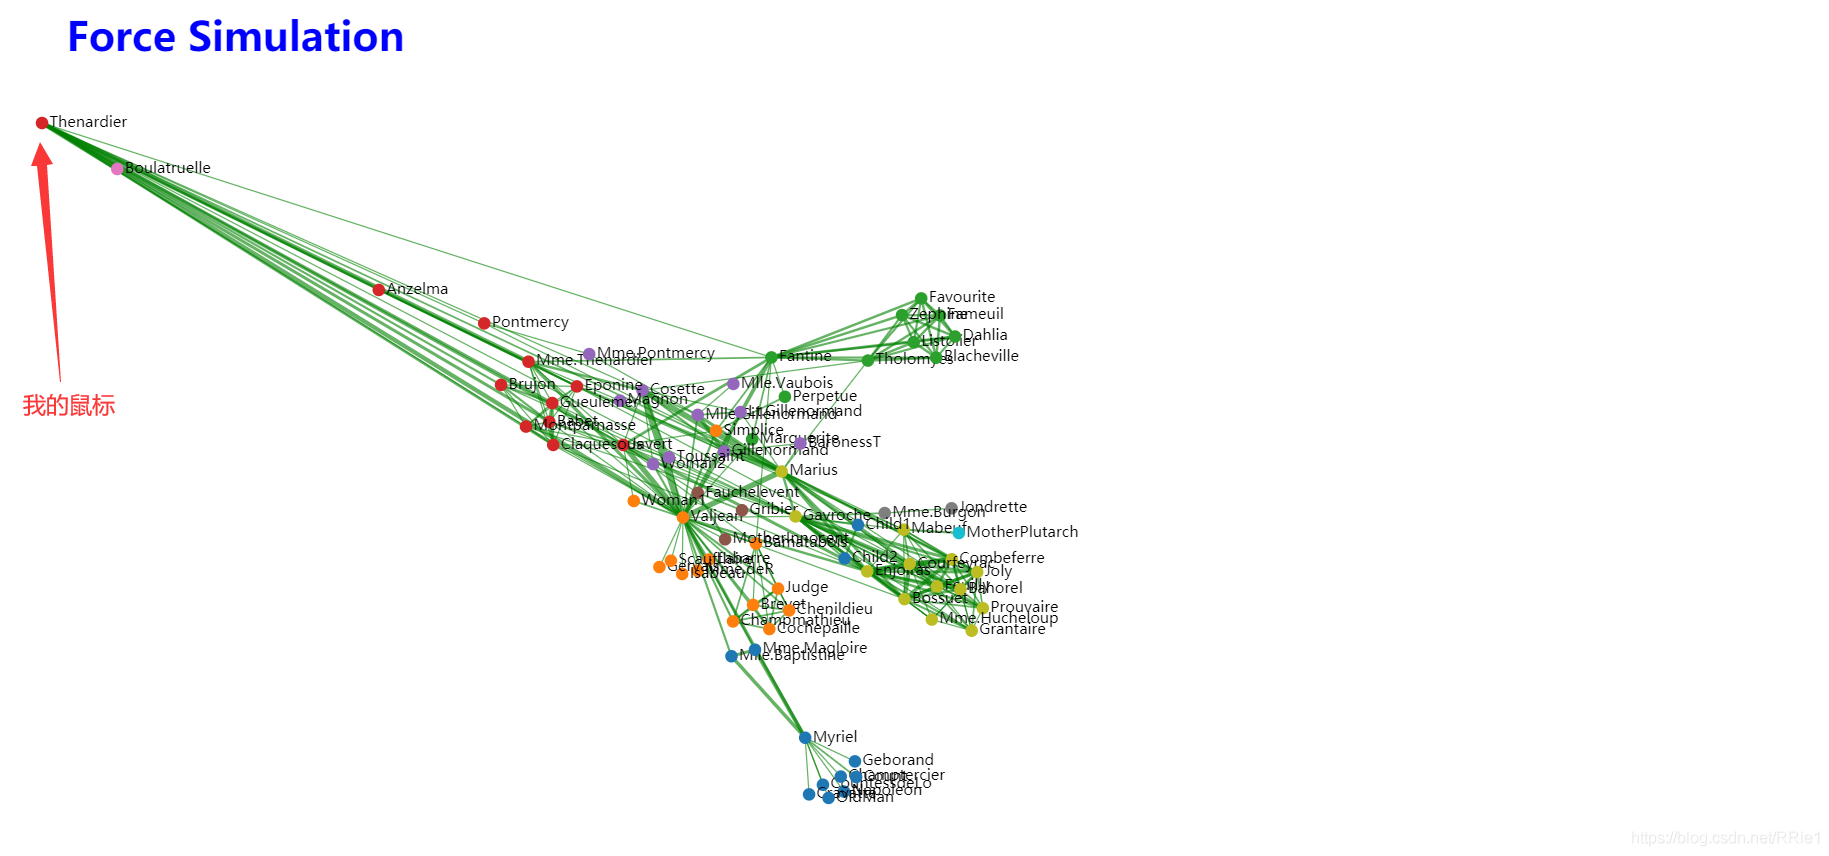
drag 拖曳交互设计
现在给图加一些交互效果:让结点能够被鼠标选中并拖拽
d3.drag()函数
drag函数有三个需要配置的,分别是拖曳开始,拖曳过程和拖曳结束
const dragFunc = d3.drag().on('start', dragstarted).on('drag', dragged).on('end', dragended);
dragstarted 拖曳开始
alphaTarget:衰减系数,对节点位置移动过程的模拟,数值越高移动越快,数值范围[0,1]restart(): 重新启动仿真的内部定时器并且返回仿真。与simulation*.alphaTarget或simulation*.alpha结合使用,这个方法可以在交互期间再次激活仿真,比如拖拽节点或者在使用simulation.stop临时暂停仿真后使用。
function dragstarted(d) {
	if (!d3.event.active) simulation.alphaTarget(0.3).restart();
	d.fx = d.x;
	d.fy = d.y;
}
dragged 拖曳过程
fx,fy:结点的最终位置
const dragged = function (d) {
	d.fx = d3.event.x;
	d.fy = d3.event.y;
};
dragended 拖曳结束
最后将fx和fy设置成null,表示拖曳结束后让结点回到力模拟的位置,而不是停留在拖曳的位置
const dragended = function (d) {
	if (!d3.event.active) {
		simulation.alphaTarget(0);
	}
	//让它回到原来的位置
	d.fx = null;
	d.fy = null;
};
调用方式
dragFunc(nodes); //param:拖曳对象
完整代码
<!doctype html>
<html>
	<head>
		<title>force</title>
		<script src="./js/d3.min.js"></script>
	</head>
	<body>
		<svg width="1200" height="650"></svg>
		<script>
			const svg = d3.select('svg');
			const height = +svg.attr('height');
			const width = +svg.attr('width');
			const margin = {
				top: 150,
				left: 50,
				right: 50,
				bottom: 0,
			};
			const innerHeight = height - margin.top - margin.bottom;
			const innerWidth = width - margin.left - margin.right;
			var color = d3.scaleOrdinal(d3.schemeCategory10);
			let link;
			let nodes;
			let simulation;
			const render_init = function () {
				svg
					.append('text')
					.attr('class', 'title')
					.attr('font-size', '2em')
					.attr('x', margin.left)
					.attr('y', margin.top / 2)
					.attr('transform', `translate(0,-40)`)
					.attr('font-weight', 'bold')
					.attr('fill', 'blue')
					.html('Force  Simulation');

				svg
					.append('g')
					.attr('id', 'maingroup')
					.attr('x', margin.left)
					.attr('y', margin.top)
					.attr('transform', `translate(${margin.left},${margin.top})`)
					.attr('width', innerWidth)
					.attr('height', innerHeight);
			};

			const tick = function () {
				link
					.attr('x1', (d) => d.source.x)
					.attr('y1', (d) => d.source.y)
					.attr('x2', (d) => d.target.x)
					.attr('y2', (d) => d.target.y);

				nodes.attr('transform', (d) => `translate(${d.x},${d.y})`);
			};

			const dragstarted = function (d) {
				if (!d3.event.active) {
					//// 设置衰减系数,对节点位置移动过程的模拟,数值越高移动越快,数值范围[0,1]
					simulation.alphaTarget(0.3).restart();
					d.fx = d.x;
					d.fy = d.y;
				}
			};

			const dragged = function (d) {
				d.fx = d3.event.x;
				d.fy = d3.event.y;
			};

			const dragended = function (d) {
				if (!d3.event.active) {
					simulation.alphaTarget(0);
				}
				//让它回到原来的位置
				d.fx = null;
				d.fy = null;
			};

			d3.json('./data/miserables.json').then((data) => {
				console.log(data);
				render_init();
				const group = d3.select('#maingroup');
				simulation = d3
					.forceSimulation()
					.nodes(data.nodes)
					.force(
						'link',
						d3.forceLink(data.links).id((d) => d.id),
					)
					.force('manyBody', d3.forceManyBody())
					.force('center', d3.forceCenter(innerWidth / 2, innerHeight / 2))
					.on('tick', tick);

				//注意设置stroke
				link = group
					.append('g')
					.attr('class', 'linkgroup')
					.selectAll('line')
					.data(data.links)
					.enter()
					.append('line')
					.attr('stroke-width', (d) => Math.sqrt(d.value))
					.attr('stroke', 'green')
					.attr('stroke-opacity', 0.6);

				nodes = group
					.append('g')
					.attr('class', 'nodegroup')
					.selectAll('.node')
					.data(data.nodes)
					.join('g')
					.attr('class', 'node');

				var circle = nodes
					.append('circle')
					.attr('r', 5)
					.attr('fill', (d) => color(d.group));

				var label = nodes
					.append('text')
					.attr('x', 6)
					.attr('y', 3)
					.html((d) => d.id)
					.attr('font-size', '12px');

				const dragFunc = d3
					.drag()
					.on('start', dragstarted)
					.on('drag', dragged)
					.on('end', dragended);

				dragFunc(nodes); //拖曳对象
			});
		</script>
	</body>
</html>
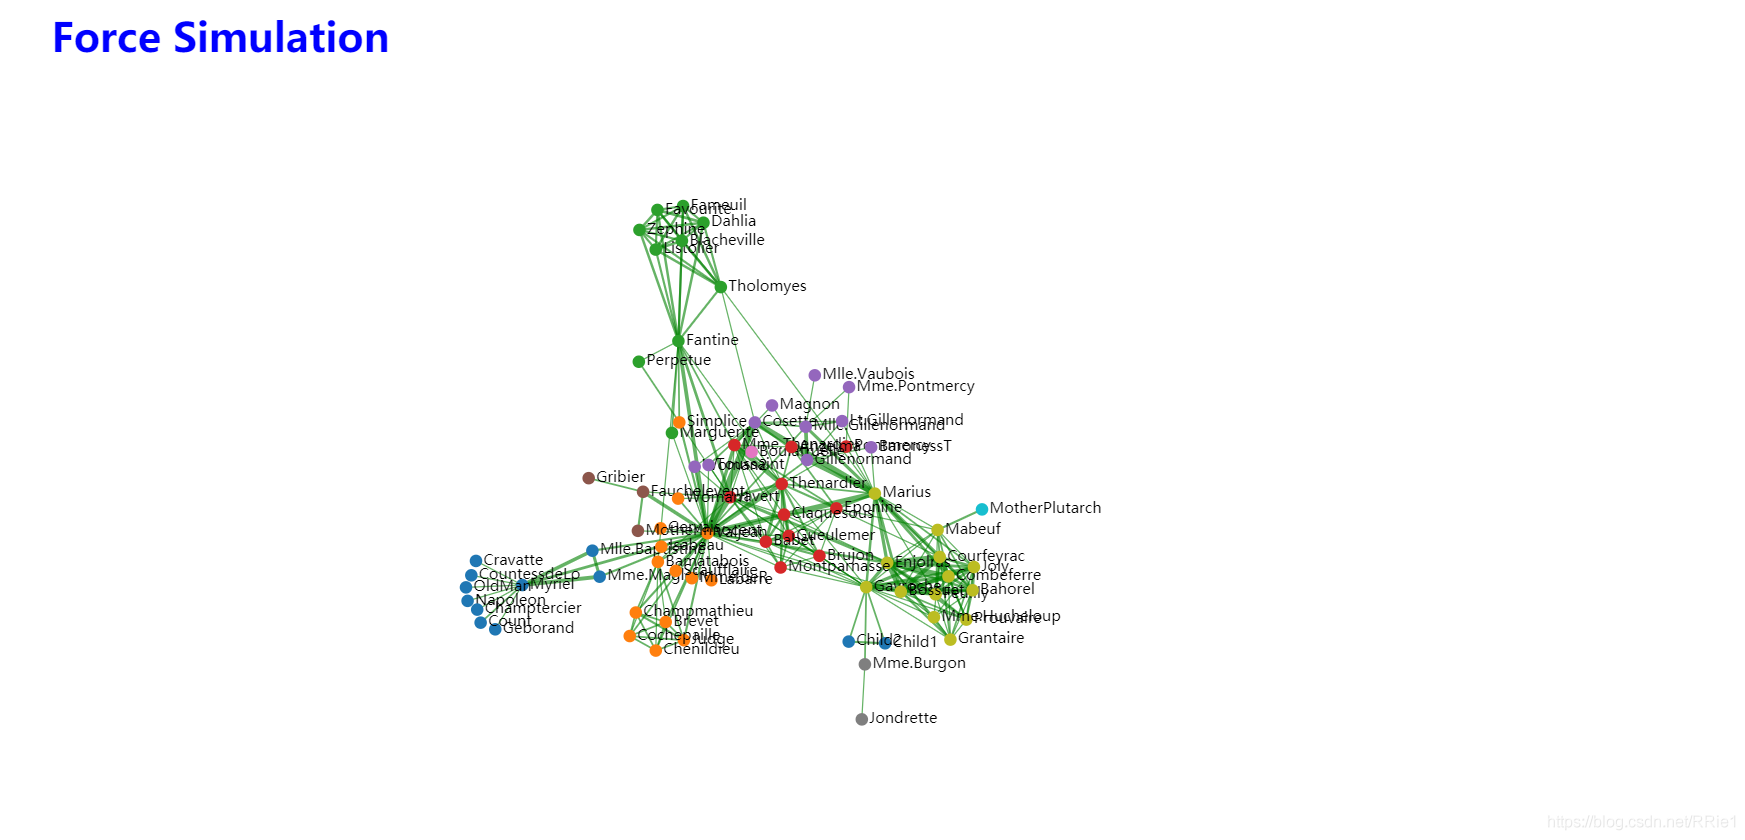
效果
初始
拖曳
评论区载入中